VEGAS TRADES GOLD IMAGE

VEGAS TRADES GOLD IMAGE
Showing posts with label exhaustion. Show all posts

Saturday, November 23, 2013

A CLOSER LOOK AT GBPAUD


                           I See Great Opportunity Here

Here are the rules for trading I am going to use to trade GBPAUD [and by extension for those who wish to trade EURAUD, GBPJPY, and EURJPY].

1)      I place a colored [your choice of color from platform selection] horizontal line at the Monday open [00:00]. [Note: Sunday afternoon action goes into the prior weeks candlestick chart.]
2)      This weekly open line is our demarcation line for being long/short. 30 pips + or – from this open marks the price for initiating long/short positions. From there I follow the yellow/plum line signals.
3)      At any time during the week if the market is in this “no mans land” of + or – 30 pips from the open, I ignore all signals until it moves one way or the other out of this box.
4)      The current Risk Model [RM] for GBPAUD is RM = 2; since I am more conservative, I choose to use the aqua exhaustion line for liquidation should price hit it or go beyond it.
5)      I don’t know for absolute certainty which market hours I will trade this pair. Since AUD is the denominator pair, and the Asian session includes Australia as well as China news, we are going to see some nice price moves, especially in the later Asian session when China usually releases economic news. Initially I am going to try and catch the later half of Asia, all of Europe, and see what is happening at the start of US trading before I call it a day. I don’t know if I can keep this schedule, but I’m going to give it a shot.
6)      My goal is 100+ pips per week on multiple lots.

There are 3 areas I want to cover in more detail to show you what to do when the algorithm presents you with these circumstances; 1) exhaustion line exit and then re-entry, 2) placing of stops and/or liquidation based on the yellow/plum signals, and 3) one  special rule after large moves.

In a strong [up or down] moving market, often times the market will move to the exhaustion line, back off, and then start again with a vengeance in the original direction without ever presenting us with a “new” signal. How do we handle this so we can get back in after some minor correction?

                                    [Click Too Enlarge To Full Screen]

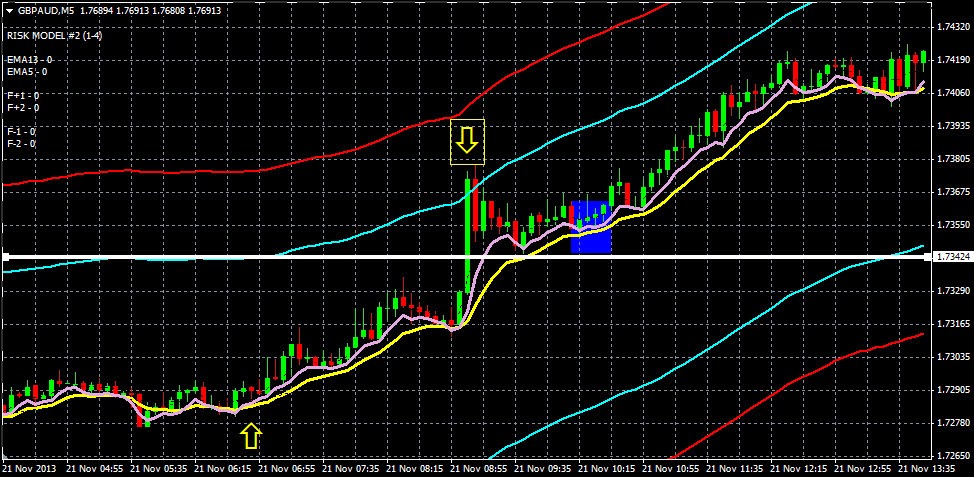
The candlestick chart directly above is from Friday’s action; the first yellow arrow is our long position entry; the boxed yellow arrow is our exit because the aqua exhaustion line has been hit. So what do we do now to get back in?

You wait for the plum and yellow lines to get very close to each other after the exhaustion move; you re-enter the market in the blue boxed area with a tight stop [the white horizontal line]. This stop is a) just below previous current support, and b) if hit the plum line would be below the yellow line signaling you wouldn’t want to be long anyway. Just looking at the chart, your risk here is about 10-15 pips [bid price].

When the market slows down, you have to be more judicious in a) following the plum/yellow line signals, and then by default b) setting your stops.

                                    [Click Too Enlarge To Full Screen]

The candlestick chart directly above is from Thursday’s price action, the blue box highlights an area where price is starting to congest and get choppy; we don’t know how long this will last, but the last thing we want to do is get in, then get out, get back in, get out again, etc., all the while suffering the dreaded chop-chop 10 pip losses numerous times.

When you start to see this, you have to recognize it, and then place an appropriate stop level where, if hit, the chop will have ended. Here, in this example, the 2 horizontal lines would be appropriate stop levels for a long position. The first one [in white] is obviously tighter than the second one [in green], and which one you choose depends on your risk tolerance. They both are good choices. This is how you handle the chop.

There is a special rule for trading; anytime a week is up or down more than 500 pips from the previous week [and closes the week at or near the high/low], the lower threshold for getting short is changed from -30 from the open to -150 pips from the open if the market was higher, and the higher threshold for getting long is changed from +30 pips from the open to +150 pips from the open if the market was lower.

In addition, if the market was up that 500 + pips, all long signals can be taken to the -150 pips from the open and if the market was down that 500 + pips, all short signals can be taken to the +150 pips from the open.

This special rule IS ONLY FOR WEEKS FOLLOWING 500 + PIP MOVES IN THE MARKET, WHERE THE CLOSE IS AT OR NEAR THE HIGH/LOW. IT IS NOT FOR OTHER WEEKS. This allows us to take advantage of carry over momentum from week to week when the market is trending strongly IN ONE DIRECTION.

So, since last week saw GBPAUD up about 530 pips on the week and closed very near the high of the week, the special rule is in effect for this upcoming week. Therefore, from the open on Monday, -150 pips from the open we follow the long signals, and if the market goes -150 from the open we would then follow only the short signals.

[Note: for EURAUD and GBPJPY it is a 400 pip week, and for EURJPY it is a 300 pip week. The threshold level for EURAUD and GBPJPY is also 150 pips, and for EURJPY it is 100 pips.]

For those of you who either don’t know what the algorithm looks like on the chart or don’t have a Forex-Metal MT4 demo [or live] account, the following 3 charts are for the entire day of Friday. I am including them here so you can see with your own eyes the power of the algorithm.

Friday November 22, 2013, 5 minutes at a time from the Forex-Metal server 00:00 [Thursday night] to the Friday close at 21:50 are reproduced below in three consecutive charts.

                                    00:00 to 08:00 – Grid Box Is 11.5 Pips

                                    08:00 to 16:00 – Grid Box Is 9.0 Pips

                           16:00 to 22:00 Close – Grid Box Is 11.5 Pips

When you look at this day, you should intuitively understand why I want to trade this FX pair. Overlayed onto the 5M candlestick chart is the “long term –vegas Big Bang Algorithm” in RM = 2 mode. Since the week is “up” [i.e. green on the weekly candlestick] we are only interested in being long the pair. Therefore, we want to get long on the plum line crossover of the yellow line.

The power of the algorithm has at its heart the yellow/plum line crossover. The margin of error on this visual representation is about 5.2% from the pure math; close enough for us to be right there when momentum changes via the Fibonacci ratios and the most important of the Gann angles.

As Bert once told me, “kid, your analysis doesn’t have to be perfect to make a million bucks in this business; you do, though, have to be perfectly disciplined”.

I want to remind everyone again, I have Patrick Mikula’s 209 page [PDF] “The Definitive Guide To Forecasting Using W.D. Gann’s Square of Nine” publication from 2003. Over the years, I have read and reread this hundreds of times; it is a great source of inspiration, thought, and ideas. Every time I revisit this work I see something different and get a bunch of ideas I want to think through and then check out. Of course, most often times my “out-of-the-box” ideas bear no fruit, but it adds to my education and market perspective. After all, I’m just a student of the market.

If you would like this publication for your electronic library, simply email me at vegasalgo@yahoo.com and I will send ASAP.

Have a great day everyone.

-vegas

Sunday, November 10, 2013

UNDERSTANDING EXHAUSTION MOVES


                                           States Of Volatility

Back in the day, when trading pits ruled the world, I had a clerk who stood outside the pit and did all of the early algo calculations for me. I got her access to the pit, and she would literally bully her way through walls of guys, twice her size, to get to me and give me info.

My first trading floor algo’s had no risk models [RM’s] attached to them. Although I was well aware of the different states of volatility associated with the various financial markets [FX, gold, and S&P 500 futures], there was no specific formula I followed for 2 very big reasons; 1) calculations were already burdensome for my clerk, and adding further non-linear differential equations to the mix would have probably killed her, and 2) I could literally feel the difference in the pit when they occurred. You didn’t need for anybody to tell you things were magnitudes of order bat-excrement crazy.

                              Stuck In A Long Position @ 1310?
                              Here, Let Me Help You By Offering Some @ 1308
                              Are We Still Golfing Buds?

A funny thing happened between about 1999 – 2003 that changed the paradigm of trading forever; the internet and specifically high-speed internet. Initially, the exchanges [specifically the Criminals Marketplace Exchange] whole-heartedly supported electronic trading because they thought it would further enhance pit trading [and by extension more business for the “Chicago way” politically connected corrupt broker groups and their bagmen].

What they didn’t see was that in a very short period of time it would send pit trading to the dustbin of history. Enter the electronic era and all that goes with it.

Now, we got ourselves a different ballgame, and so how do you construct and get a readout of the volatility [in an electronic trading platform environment]] that you can use and be effective in making money?

There were problems to overcome that came from literally everywhere. What platform to use? Can I get reliable charts? Can I code these charts? What code to use? This is just the tip of the iceberg here, and so you get the idea.

Finally, a duo of Russians got together and came up with Metatrader. Originally designed for brokerage houses, it very quickly became the de facto trading platform for individuals because of a) its flexibility and simplicity of design, and more importantly for many of us, 2) you could code your own trading signals through the mq4 [basically Java] language.

When I was just a young skull full of mush in the late 70’s, apprenticing under Bert, I was introduced and influenced by the works of Gann, Elliot, and Fibonacci. Back then nobody had computers and everything was done by hand; colored pencils, chart paper, all the math, and the final product was usually a pain-staking chart that took many hours to make and great discipline to update in real time.

I spent a few years [in semi-retirement because I was playing golf every day of the week] solving all these problems and finally got it figured out to my satisfaction sometime in 2005. I intuitively knew that electronic markets would be almost impossible to scalp, therefore when my first exhaustion model was introduced to the public, via the internet, it was titled as The 1 Hour Tunnel Method.

In the 8 years since, all of the updated –vegas algorithm versions have had the original exhaustion formulas included in them, and to this day is one of the only REAL TIME TECHNICAL INDICATORS THAT CAN GET YOU OUT OF EITHER SHORT POSITIONS AT THE BOTTOM OR OUT OF LONG POSITIONS AT THE TOP, THAT YOU WILL FIND IN ANY ALGORITHM NO MATTER THE COST [FREE OR MUCHO $$$].

Since trading absolutely mirrors life, why shouldn’t physics [and by proxy advanced math] be our guide when it comes to acceleration [traditional Newtonian physics] and quantum mechanics?

What we get are “quantum jumps, or states.” There is no gradual increase [or decrease] in volatility; what we get in trading are “jumps” to different trading energy levels in a heartbeat, that last until the fuel runs out [buying/selling as acceleration], and then the market jumps back to normal just as quickly.

Kind of like water; you have 4 states that can exist. Depending on molecular activity [volatility] you can have ice [RISK MODEL=1], water [RM=2], steam [RM=3], and plasma gas [RM=4].

In the various mq4 files that are available for free in the “File Download Links” section of the blogsite, all of the various market mq4 files have the exhaustion lines [aqua and red] plotted automatically in real time with 4 different RM’s that you can click back and forth [in about 2 seconds] to see, in real time again, where the market is at volatility wise.

The aqua exhaustion line is for more conservative traders, the red line for more aggressive traders, or you can use the "tunnel" between the two. In essence, it's an area of exhaustion that probability [based on historical price data] tells us cannot be sustained for much longer. Therefore, a perfect place to exit.

Each market [i.e. XAUUSD, the CFD for WTI Crude Oil, and ALL FX pairs] has its own personality risk models based on Fibonacci ratios that are specific to it. Therefore, using the gold mq4 isn't going to mean anything plotted on an FX pair or with crude oil. Each mq4 file is specifically designed for its named file.

Spot gold [XAUUSD] has recently been trading in RM=1 mode, so the candlestick 5M chart is in that mode.  On Thursday of last week we got a jump up, and looking at the chart what do we see:

                           XAUUSD 11/7/2013 RM=1 Exhaustion

So, what we see here is the market rushing up to the exhaustion lines, where if you were long you would immediately liquidate [I didn’t say initiate] your position. Once the longs were trapped, you saw violent action to the downside 40 minutes later where it violates the aqua and red lines on the downside [if for some reason you were short this would be getting you out].

Then comes Friday and the NFP. Here is the 5M [with RM=1] from Friday:

                           XAUUSD 11/8/2013 RM=1 Exhaustion

Notice here how the gap down went way past the RM=1 model; what does this mean? It means the market is at a new energy state. With the click of the mouse here is the same chart with RM=3:

                           XAUUSD 11/8/2013 RM=3 Exhaustion

Notice the low of the move ends almost exactly at the aqua and red lines.

If the algo had us short, a quick click of the mouse would have shown that this was the end of the move and time to get out.

THIS IS THE POWER OF THE EXHAUSTION LINES!

I intentionally coded, with visual reference, these 4 states of volatility to help you figure out very quickly where the market is at in regards to volatility, so that you can use this information [in real time] to your advantage and get out at the very best price when the situation warrants.

Use this to your advantage!.

Have a great day everyone.

-vegas

P,S.
To enlarge one of the exhaustion charts to fill your screen, simply place your mouse on the chart and click. It should then fill your screen for better viewing.