VEGAS TRADES GOLD IMAGE

VEGAS TRADES GOLD IMAGE
Showing posts with label EURAUD. Show all posts

Wednesday, January 8, 2014

WAKE ME UP WHEN SOMETHING HAPPENS


                               Watching The JPY & AUD Crosses

We start 2014 with one of the worst trading weeks imaginable; oh, too be sure it will happen again, action just this side of wanting to watch “The Brady Bunch” reruns instead of your computer screen.

At our last weekly staff meeting I said, “You just wait, sometime in January we’ll get a week or two that will be crap action wise; where the range will be small and put in during the wee hours of Asia or the U.S. late afternoon, and the market [pick one, it doesn’t matter] will diddle around the +30 to -30 Pips from the weekly open, and I’ll get emails from people wondering if I have died because I haven’t done anything.”

Cousin It pipes in, “Nah, that won’t happen”. “Wanna bet?”, I said.

Needless to say, this weekend I get a free snow cone down at the beach courtesy of the entire staff who is chipping in to cover this mighty expense. I just hope my watermelon snow cone doesn’t have the whiff of almonds when they hand it to me.

I have so far been concentrating on GBPJPY because the spread over all the sessions is right around 1 pip [give or take a few tenths]; GBPAUD on the other hand only has that 1 pip spread for about 5 or 6 hours when both Europe and the U.S. overlap and are trading, and the rest of the day the spread is between 2 – 4 ½ pips.

Even though during this time both GBP and AUD versus the U.S. Dollar has spreads less than 1 pip respectively. So, how come a 4 pip spread 5 hours into the Asian session? Simple; the banks don’t want you picking them off from scalping a volatile pair, and are simply protecting themselves from nasty customer scalp operations via multiple computer EA’s [Expert Advisors] and Eastern European types who got nothing better to do than trade 7 round turns in 40 seconds, each time taking less than a pip from 5 Million stuff.

The other pairs [GBPJPY and EURAUD] are much deeper in liquidity, therefore no need to widen the spread unnecessarily when action is dull. So, my first priority starting the week will be in GBPJPY and then, if necessary, I’ll take a look at EURAUD. We basically are looking at 1 pip markets in each.

True to its nature and most important function, the Long Term algorithm has done a beautiful job of keeping us all out of trouble in GBPJPY the first 3 days of this week. I have made no trades simply because the algorithm really hasn’t called for any [remember the rules everyone]. Granted, late Tuesday morning in the European session, you could have gotten long on a breakout of 1.7246 on the upside. I didn’t take the trade because I didn’t think the market had anyplace to substantially go pre-NFP Friday and the unemployment numbers the BLS will make up.

As things turned out, I was right about this. Other than that, the sharp decline to the lows happened Sunday afternoon and very early in Asia on Monday. From there it has been a slow and haphazard rise up back to the weekly open. Three days in, and right now, we are only about 50 pips from the weekly open; not exactly the stuff legendary moves are made.

Oh, not to worry, as I am sure on Friday both new lows and highs for the week can be expected within half an hour as retail accounts become acquainted again with the casino environment of an NFP Friday.

For everyone that wrote me wondering if I had died and praying for some market action, I can assure you the boredom from watching GBPJPY, early Monday to the present, hasn’t quite turned me to room temperature. However, I do have some advice;

                                          Take Two If Necessary

Last time I checked, I can’t deposit trades into the bank; for that we need real money. Not too worry tradeaholics, everything is fine and well.

Have a good day everyone.

-vegas

P.S.
Another email blast has got me about 2-3 days behind in answering emails. I’ll get to ‘em, so if you’re waiting to hear from me, rest assured an answer is coming very soon. Thanks.

Saturday, November 23, 2013

A CLOSER LOOK AT GBPAUD


                           I See Great Opportunity Here

Here are the rules for trading I am going to use to trade GBPAUD [and by extension for those who wish to trade EURAUD, GBPJPY, and EURJPY].

1)      I place a colored [your choice of color from platform selection] horizontal line at the Monday open [00:00]. [Note: Sunday afternoon action goes into the prior weeks candlestick chart.]
2)      This weekly open line is our demarcation line for being long/short. 30 pips + or – from this open marks the price for initiating long/short positions. From there I follow the yellow/plum line signals.
3)      At any time during the week if the market is in this “no mans land” of + or – 30 pips from the open, I ignore all signals until it moves one way or the other out of this box.
4)      The current Risk Model [RM] for GBPAUD is RM = 2; since I am more conservative, I choose to use the aqua exhaustion line for liquidation should price hit it or go beyond it.
5)      I don’t know for absolute certainty which market hours I will trade this pair. Since AUD is the denominator pair, and the Asian session includes Australia as well as China news, we are going to see some nice price moves, especially in the later Asian session when China usually releases economic news. Initially I am going to try and catch the later half of Asia, all of Europe, and see what is happening at the start of US trading before I call it a day. I don’t know if I can keep this schedule, but I’m going to give it a shot.
6)      My goal is 100+ pips per week on multiple lots.

There are 3 areas I want to cover in more detail to show you what to do when the algorithm presents you with these circumstances; 1) exhaustion line exit and then re-entry, 2) placing of stops and/or liquidation based on the yellow/plum signals, and 3) one  special rule after large moves.

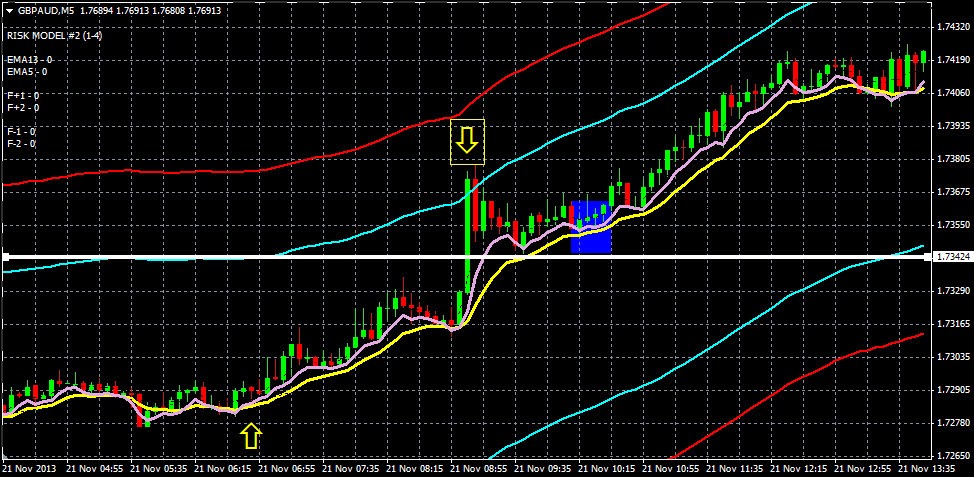
In a strong [up or down] moving market, often times the market will move to the exhaustion line, back off, and then start again with a vengeance in the original direction without ever presenting us with a “new” signal. How do we handle this so we can get back in after some minor correction?

                                    [Click Too Enlarge To Full Screen]

The candlestick chart directly above is from Friday’s action; the first yellow arrow is our long position entry; the boxed yellow arrow is our exit because the aqua exhaustion line has been hit. So what do we do now to get back in?

You wait for the plum and yellow lines to get very close to each other after the exhaustion move; you re-enter the market in the blue boxed area with a tight stop [the white horizontal line]. This stop is a) just below previous current support, and b) if hit the plum line would be below the yellow line signaling you wouldn’t want to be long anyway. Just looking at the chart, your risk here is about 10-15 pips [bid price].

When the market slows down, you have to be more judicious in a) following the plum/yellow line signals, and then by default b) setting your stops.

                                    [Click Too Enlarge To Full Screen]

The candlestick chart directly above is from Thursday’s price action, the blue box highlights an area where price is starting to congest and get choppy; we don’t know how long this will last, but the last thing we want to do is get in, then get out, get back in, get out again, etc., all the while suffering the dreaded chop-chop 10 pip losses numerous times.

When you start to see this, you have to recognize it, and then place an appropriate stop level where, if hit, the chop will have ended. Here, in this example, the 2 horizontal lines would be appropriate stop levels for a long position. The first one [in white] is obviously tighter than the second one [in green], and which one you choose depends on your risk tolerance. They both are good choices. This is how you handle the chop.

There is a special rule for trading; anytime a week is up or down more than 500 pips from the previous week [and closes the week at or near the high/low], the lower threshold for getting short is changed from -30 from the open to -150 pips from the open if the market was higher, and the higher threshold for getting long is changed from +30 pips from the open to +150 pips from the open if the market was lower.

In addition, if the market was up that 500 + pips, all long signals can be taken to the -150 pips from the open and if the market was down that 500 + pips, all short signals can be taken to the +150 pips from the open.

This special rule IS ONLY FOR WEEKS FOLLOWING 500 + PIP MOVES IN THE MARKET, WHERE THE CLOSE IS AT OR NEAR THE HIGH/LOW. IT IS NOT FOR OTHER WEEKS. This allows us to take advantage of carry over momentum from week to week when the market is trending strongly IN ONE DIRECTION.

So, since last week saw GBPAUD up about 530 pips on the week and closed very near the high of the week, the special rule is in effect for this upcoming week. Therefore, from the open on Monday, -150 pips from the open we follow the long signals, and if the market goes -150 from the open we would then follow only the short signals.

[Note: for EURAUD and GBPJPY it is a 400 pip week, and for EURJPY it is a 300 pip week. The threshold level for EURAUD and GBPJPY is also 150 pips, and for EURJPY it is 100 pips.]

For those of you who either don’t know what the algorithm looks like on the chart or don’t have a Forex-Metal MT4 demo [or live] account, the following 3 charts are for the entire day of Friday. I am including them here so you can see with your own eyes the power of the algorithm.

Friday November 22, 2013, 5 minutes at a time from the Forex-Metal server 00:00 [Thursday night] to the Friday close at 21:50 are reproduced below in three consecutive charts.

                                    00:00 to 08:00 – Grid Box Is 11.5 Pips

                                    08:00 to 16:00 – Grid Box Is 9.0 Pips

                           16:00 to 22:00 Close – Grid Box Is 11.5 Pips

When you look at this day, you should intuitively understand why I want to trade this FX pair. Overlayed onto the 5M candlestick chart is the “long term –vegas Big Bang Algorithm” in RM = 2 mode. Since the week is “up” [i.e. green on the weekly candlestick] we are only interested in being long the pair. Therefore, we want to get long on the plum line crossover of the yellow line.

The power of the algorithm has at its heart the yellow/plum line crossover. The margin of error on this visual representation is about 5.2% from the pure math; close enough for us to be right there when momentum changes via the Fibonacci ratios and the most important of the Gann angles.

As Bert once told me, “kid, your analysis doesn’t have to be perfect to make a million bucks in this business; you do, though, have to be perfectly disciplined”.

I want to remind everyone again, I have Patrick Mikula’s 209 page [PDF] “The Definitive Guide To Forecasting Using W.D. Gann’s Square of Nine” publication from 2003. Over the years, I have read and reread this hundreds of times; it is a great source of inspiration, thought, and ideas. Every time I revisit this work I see something different and get a bunch of ideas I want to think through and then check out. Of course, most often times my “out-of-the-box” ideas bear no fruit, but it adds to my education and market perspective. After all, I’m just a student of the market.

If you would like this publication for your electronic library, simply email me at vegasalgo@yahoo.com and I will send ASAP.

Have a great day everyone.

-vegas

Sunday, September 29, 2013

THE DATA HAS NO AGENDA


                                 What A Real ATM Looks Like

Instead of releasing a new file, I have decided to make the longer term “-vegas Big Bang Algorithm” available right here on the blog. The algo rules are exactly the same as found in the “-vegas For Life” file, with one major difference; instead of using the daily candlestick, we use a weekly candlestick chart.

The Monday opening is where the horizontal line is created and that is used for the entire weekly trade. For the 2 financial instruments I am going to recommend you trade [because they make you the most money], initial buy/sell positions are initiated at the +/- 35 PIPS from the horizontal opening line, respectively.

Strategy will be covered in the next few blog posts; the purpose of today is to introduce you to the data and get you to think about the bigger macro picture.

For some of you, this is going to come as a shock, but the absolute best market to trade for profitability is the CFD WTI Crude Oil. The best Forex pair is EURAUD, but it is not nearly as good as the WTI CFD. The probability of successful trading in WTI Crude Oil is simply astounding, if you follow the rules in the algo.

At Forex-Metal, 1 WTI Crude Oil CFD = 100 barrels; therefore each one cent move in the market = $1. Think of crude as THE ENERGY CURRENCY and each one cent move as a PIP.

The data I am presenting is from the start of 2010 through the week of September 15, 2013. This covers 194 weeks. If I had included the time period from approximately 2005 through the end of 2009, in the data, the results would have been EVEN BETTER than what I am going to show you. I took out this 5 year period because I didn’t want the run up to $150 oil, and subsequent fall, to skew the data in a favorable light.

If you would like the complete Microsoft Excel file used to generate the data, simply email me at vegasalgo@yahoo.com and I would be happy to send it to you [ditto for EURAUD as well].

Here is the data for WTI Crude Oil.

1)      The SHORTEST DISTANCE from the OPEN [in PIPS] to either the HIGH OR LOW of the WEEK IS LESS THAN 35 PIPS occurs approximately 20% of all weeks.
2)      The SHORTEST DISTANCE from the OPEN [in PIPS] to either the HIGH OR LOW of the WEEK IS BETWEEN  35 PIPS – 100 PIPS occurs approximately 27% of all weeks.
3)      The SHORTEST DISTANCE from the OPEN [in PIPS] to either the HIGH OR LOW of the WEEK IS GREATER THAN 100 PIPS occurs approximately 53% of all weeks.
4)      The GREATEST DISTANCE from the OPEN [in PIPS] to either the HIGH OR LOW of the WEEK IS LESS THAN 175  PIPS occurs approximately 6% of all weeks.
5)      The GREATEST DISTANCE from the OPEN [in PIPS] to either the HIGH OR LOW of the WEEK IS BETWEEN 175 PIPS – 250 PIPS occurs approximately 17% of all weeks.
6)      The GREATEST DISTANCE from the OPEN [in PIPS] to either the HIGH OR LOW of the WEEK IS BETWEEN 250 PIPS – 350 PIPS occurs approximately 25% of all weeks.
7)      The GREATEST DISTANCE from the OPEN [in PIPS] to either the HIGH OR LOW of the WEEK IS GREATER THAN 350 PIPS occurs approximately 52% of all weeks.

I also want to mention, as it pertains to #4 from above, that if the week has a high value less than 175 pips from either the high or low, it most likely will have a value of about 155 - 175 pips. There was only 1 week, out of 194 weeks, that this value was less than 140 pips.

I want to give you a couple of days to reflect on this data, as the information contained in it is explosive. The size of the pips and the high percentages should blow your mind; there isn’t another financial instrument that you can trade that comes close to these numbers.

Just as an example, to show you the difference in percentages, EURAUD [the best Forex pair according to the data] from the start of 2010 to the present, #7 value of greater than 300 pips [not 350] occurs approximately 23% of all weeks. Crude has about 2 ½ TIMES GREATER weeks AND a 50 PIP higher threshold!!

Starting next post, I’ll get into the strategy, and lay out the trading scenarios I think offer the very best approach to making money.

Until then, have a great day everyone.

-vegas

Monday, September 16, 2013

A CURRENCY PAIR WORTH TRADING


                                        It’s Why We Are Here

Over the last couple of weeks, I’ve gotten quite a lot of mail from people asking me about EURAUD. This currency pair, for you Newbies, is the Euro priced in Australian Dollars; so a quote of 1.42830 bid [sell] / 1.42860 ask [buy] gives you the sell/buy of how many Australian Dollars it takes to sell/buy 1 Euro.

This pair meets all of the important criteria I have set forth in the “-vegas Big Bang Algorithm” which is in the “-vegas For Life” file. Right now, I have my staff working on the Excel spreadsheet analysis that was done for EURJPY & GBPJPY.

                             Crunching Numbers @ $0.95 / Hour

I will release the analysis as soon as it is finished and then verified. I will then link it in the downloads section so you can download the entire Excel file if you wish.

Forex-Metal offers EURAUD for trade with a bid/offer spread of about 3 pips, which I consider to be very good to excellent. When you consider the spread on the EURUSD is about 1.5 – 2.0 and the spread on AUDUSD is about 2.5 – 3.0, you are getting the cross at about 1.5 pips on each side. At the retail level you will be hard-pressed to get a significantly lower spread.

Throughout my trading career, I have consciously remained vigilant NOT to be a “one-trick pony”. I’m not married to any currency pair or commodity. If it’s “hot” [above average volatility] I’m interested; if it slows down, it takes just a click of my mouse and I’m somewhere else.

What I [and you for that matter] need for success is constant above average volatility that we can capitalize on and profit. From a purely diversification standpoint, it also makes sense to include this pair to trade as it is removed from the Yen [USDJPY].

In any non Dollar cross, the important Dollar pair is the denominator. As long as the denominator moves, the cross will be volatile regardless of what the numerator does. A quick look at the daily charts shows that AUDUSD is just as volatile as USDJPY on most days.

So, as long as the spread is good, there’s no reason to ignore EURAUD.

Have a good day everyone.

-vegas